Weathering Risk Management Data
When it comes to data science, few areas create the demand for sophisticated big data tools quite like climate studies and risk management.
Blending the two of these application areas means overcoming a long list of computational and data management challenges. For a company like 3TIER, making it over these hurdles is a business-critical task–one that gets more complex as more data sources are added.
3TIER brings together the big data problems of risk management and weather science to help users make informed choices about energy investments.
Their customers maintain sharp eyes on the energy output (translate: financial) performance of renewable energy sources—which means that the sources that drive the energy (wind, sun, water, etc.) must be analyzed as well to calculate risk and patterns.
As 3TIER describes, they make use of “weather science to help clients manage the risk of weather-driven variability—anywhere on earth and across all time horizons.” They say it’s not just about data—it’s about speedy actionable intelligence.
3TIER provides renewable energy risk management decision information in the form of tools like their FirstLook platform, which allows users to make quick comparisons of wind and solar sites with wind speeds, solar values, and global resource rankings for different sites around the world. As one can imagine, this involves one heck of a lot of data.
According to Jim McCaa, Director of Scientific Computing at 3Tier, “It’s very challenging to commit to many millions or even billions of dollars for an energy portfolio without really understanding the risk associated with having a less than normal windy year of having more sun than average.
McCaa says, “For us as a company, even though we know that, at the end of the day we may be sending out something that is a few thousand bytes to the client, we may be churning through many terabytes of data to get there.”
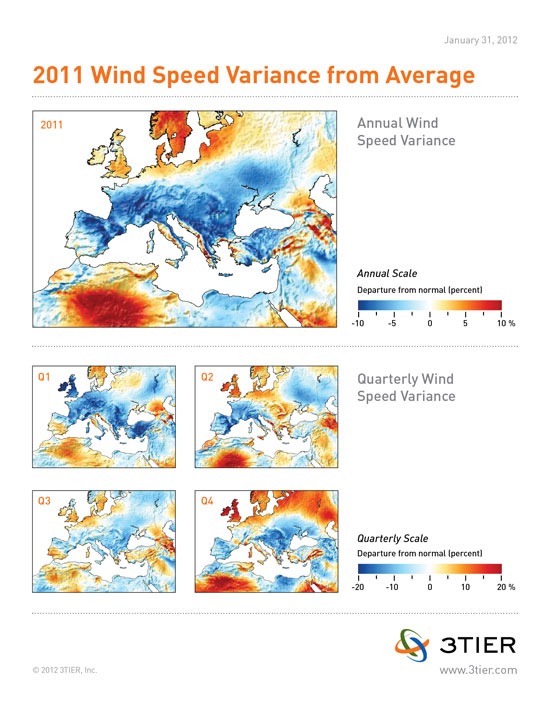
To get a better sense of the output from all this data, below is a wind map for Europe the team behind the company generated to help investors better understand how a potential renewable energy investment might play out. The wind performance maps were created by comparing hourly data for 2011 with hourly wind conditions averaged over the period 1981-2010 from 3TIER’s continually updated European meteorological dataset.

Related Stories
7 Big Winners in the U.S. Big Data Drive
Analytics Power Solar Energy Boost


