Big Data Outlier Detection, for Fun and Profit

As we discussed in the first part of this series, how you handle data outliers can determine whether your big data project ends with a bang or flames out in failure. But before you even decide what to do with outliers, you need to be able to detect them. That is easier said than done.
Because they can mean different things at different times, outliers can be extremely challenging to deal with in a big data context. On the one hand, the presence of an outlier may signal the hacker who just hacked your system, the golden buying opportunity in the stock market, or an unhappy customer. On the other hand, outliers may just be statistical aberrations, random instances of chance that will lead you on a wild goose chase.
You have to be able to handle both situations, says Dr. Kirk Borne, a professor at George Mason University. “The mean lines through the population is important because that gives a trend. It’s important to know the trends,” Borne says. “But if you’re dealing with individuals, it’s important to know how they deviate from the trend.”
Finding the outliers is the first step in dealing with them. Many of the big data analytical tools on the market today are basically outlier detection machines. A good number of the algorithms in the open source R package are devoted to data quality and outlier issues. RapidMiner, Alteryx, Revolution Analytics, KNIME, and other providers of advanced analytics can also bring powerful tools to bear. Various analytical and machine learning engines in Hadoop can also be brought to bear on the outlier detection problem.
However, following a purely statistical approach can lead you down the rabbit’s hole. For a simple example, let’s say you plot some data in a two-dimensional graph, and they all end up forming a circle, except for one data point (our outlier) that ends up right in the middle of the circle.
“That particular data point that happens to be at the center is exactly atop the mean of the data distribution,” Dr. Borne says. “So if you look at the statistical estimate of whether something is an outlier, and didn’t look at the picture, you would say ‘No that’s not an outlier because it’s right at the mean of the distribution.'”
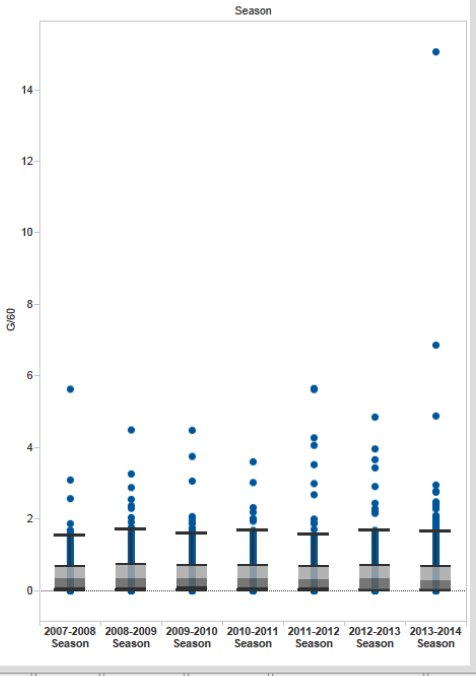
In many instances, using a visualization tool to get your eyeballs on a whole bunch of data is the best way to identify hard-to-see outliers. The visualization tools from Microstrategy, Qlik, Tableau, TIBCO, and others also offer excellent ways to see how individual data points differ from the rest.
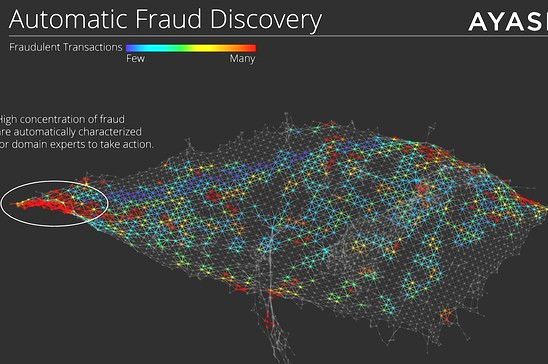
Detecting outliers gets even more difficult when the data is highly variable, the surface your data sits on is not flat, or your data exists in a three-dimensional setting. One software company that’s gaining some traction in so-called topological data analysis (TDA) is Ayasdi.
Founded by three Ph.D. mathematics students at Stanford University, Ayasdi’s software effectively allows users to give a shape to big and complex data, such as those generated with medical imaging, oil and gas exploration, and jet engine manufacturing. The Ayasdi software allows users to study the underlying structure of the data, identify sub-populations and outliers, and statistically explore their distinguishing characteristics.
“In general, a topological network provides a map of all the points in the data set, so that nearby points are more similar than distant points, rather than providing a visual representation of the behavior of one or two of the variables defining the data set,” Ayasdi says in its white paper, “Deep Dive: Topological Data Analysis.” “The network is quite analogous to a geographic map, and plays the same role in understanding of the ‘landscape’ of the data.”
What sets Ayasdi’s approach apart, however, is that the network “does not provide just a visualization, but actually an interactive model for working with the data,” the company says in its white paper. “One is able to color the network by variables used in the construction of the network, or by metadata.”
As data sets get bigger and the variety of features grows, it becomes harder to detect outliers. “Everything is trickier here, it’s hard to compute averages and look at what kinds of outliers you might have, and it’s easy to make dumb mistakes that would be obvious at smaller scales,” says Lukas Biewald, the CEO of Crowdflower.
Don’t get stuck in the rut of using just a single tool to detect outliers, says Dr. Borne. “Any kind of visual exploration is going to be really important,” he says. “The raw statistics, like means, mediums, and data distribution histograms are all great as well, but just even looking at the data is very significant. You need both the visualizations as well as some of the statistical estimators.”
Outliers can be critically important to your big data project. Depending on the context, you may be actively hunting for outliers, or you may be trying to subdue them. Whichever way your big data project takes you, you first need to detect the outliers. Taking the time to explore which approach works best for you will give you the best chance of finding success with your big data project.
Related Items:
Big Data Outliers: Friend or Foe?
How Open Source is Failing R for Big Data
The Power and Promise of Big Data Paring


