How a ‘Nuisance Variable’ Turned Into Potential Lifesaver

Puwadol-Jaturawutthicha/Shutterstock.com
There are many rabbits to chase in the world of biomedical research—way too many for scientists to chase them all down in an orderly and methodical way. But thanks to the power of new big data techniques like topological data analysis, scientists are getting a glimpse of where some of the rabbit holes might lead.
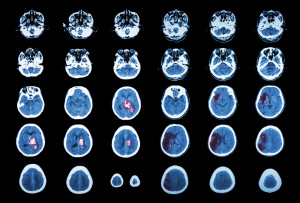
In the 1990s, scientists studying traumatic brain and spinal cord injuries embarked upon an ambitious multicenter research animal trial with the hope of finding new drugs to treat spinal cord injuries. In testing their hypothesis upon rats, they generated a large amount of data, and made some interesting findings.
One of the observations they made in the study involved blood pressure. Apparently, it is fairly common for blood pressure to fluctuate wildly in an animal that has just suffered a major brain or spinal cord injury. The same observation has been made many times in ER rooms across the country, but there are no established medical guidelines that tell doctors what to do about it.
The researchers noted the blood-pressure phenomenon, but ultimately discarded it as a “nuisance variable,” just a meaningless blip in the noise. At the end of the day, the results of the study were not robust enough to support the hypothesis about drug treatments, and the scientists decided against publishing their work in a formal paper. The data languished on the shelf for over two decades, until Adam Ferguson entered the picture.
As a recent graduate from University of California San Francisco’s postdoctoral studies program, Ferguson was trained to think differently about data than previous generations. “I was raised with data,” says Ferguson, who is the principal investigator at UCSF’s Brain and Spinal Injury Center and an assistant professor of neurological surgery at UCSF. “I knew if we put a bunch of data together, we would find things.”
Ferguson wasn’t sure exactly what tool to use to tease useful information out of the spinal cord data. His team has a lot of experience with machine learning algorithms, in particular the principle component analysis (PCA) algorithm, which is used fairly often in scientific endeavors. But PCA alone wouldn’t have been powerful enough for what his team ultimately did.
Randomized Happenstance
If the scientific method is predicated on eliminating randomness from the equation, then the manner in which Ferguson discovered the field of topological data analysis (TDA) is truly bizarre—a fluke occurrence of being at just the right place at just the right time.
While doing laundry in a San Francisco laundromat, Ferguson dropped into the pub next door to watch the Giants game on TV. He struck up a conversation with a bioinformatician who had just received a grant to build a database. Ferguson tried to hire him, but he turned Ferguson down. Instead, the man joined a big data analytics company named Ayasdi.
“A few months later,” Ferguson tells Datanami, “he came back and said ‘I know I turned down this job with you, but I’m in this great company called Ayasdi and I just keep thinking this technology can be very helpful to your field.'”
After hashing out a licensing agreement with Ayasdi, Ferguson re-ran the spinal cord data through the software company’s TDA software, and that’s where the real fun begins.
A ‘Wild Discovery’
The initial results from Ayasdi’s TDA tool—which essentially runs an ensemble of machine learning algorithms to automatically percolate up meaningful results—confirmed the study’s basic findings.
“First off, the original researchers were correct. The drug studies didn’t show a very clear unified hypothesis-driven effect,” Ferguson says. “And part of that was because there was a nuisance variable that was really driving whether these subjects had recovered locomotion. That nuisance variable was the blood pressure at the time of their injury.”
Ferguson’s team drilled into the data further with TDA, and found many other correlations—rabbits that could lead anywhere. But the correlation between high blood pressure and likelihood for full recovery proved to be very strong.
“That was kind of a surprising find,” Ferguson says. “There are many potential correlations that were in this data set, but the surprising one was that this hypertension immediately after injury is one of the biggest predictors of long-term locomotive recovery.”
That find led Ferguson to a consider whether doctors could get better outcomes from traumatic brain and spinal cord injuries just by lowering the high blood pressure with one of a number of existing drugs. It would be a relatively quick and easy fix for a type of traumatic injury that damages so many lives.
“Suddenly, this becomes a wild discovery that has implications on clinical care,” Ferguson says. “When people come into trauma centers, they’ve usually been in a car wreck and it’s a very complex situation and they have a number of other medical issues to pay attention to. And if it’s truly the case that high blood pressure immediately after the accident is one of the big predictors of bad outcome, then this is something that can be addressed immediately.”
Shortcutting the Scientific Method
TDA may have given Ferguson a huge head start in isolating one important variable among thousands of interrelated variables, but now he must do the hard work of proving that it works in the real world. Ferguson is now working with other experts in the traumatic brain and spinal cord field to prove whether the theory is correct. In October, Ferguson and his team published their initial findings in a Nature Communications article titled “Topological data analysis for discovery in preclinical spinal cord injury and traumatic brain injury.”
Ayasdi founder and CEO Gurjeet Singh has been following Ferguson’s work at UCSF. While he’s pleased with the progress Ferguson and his team have made, he’s isn’t surprised that his software was able to deliver such a powerful insight so quickly.
“This is such a non-intuitive thing that they discovered from the data. Even though they had the data–and they’ve had it for some time now–they never bothered to ask the questions,” Singh tells Datanami.
Singh continues:
“The old way of discovering knowledge from data is you collect lots and lots of data and then you keep asking questions. What was different in this case using our software is, the system automatically discovers statistically significant insight without them having to ask questions up front. What’s significant about it is they’re able to discover this thing, which is ordinarily something they would not have inquired for.”
Ferguson admits this would have been very difficult to do without a tool like Ayasdi. “We could have been 1,000 quants sitting in different rooms doing our analytics and eventually come up with it, but with TDA we did it in milliseconds,” he says. “Once we had this result, we went back to very traditional tools to confirm that it could have been determined if we knew what we were supposed to be looking for.”
“I would be surprised if we don’t confirm” the findings, Ferguson continues. “But it’s early days. Doing the hard work of experimental confirmation takes time. In the past doing the hard work of data mining took time. What we just experienced here is that, with high-end novel analytics, like this cloud-based tool, you can rapidly discover something that could have taken years to discover before. To even know where to begin in a complex system, a tool like TDA was extremely valuable.”
Related Items:
Big Data Outliers: Friend or Foe?
Mapping the Shape of Complex Data with Ayasdi
Big Data Outlier Detection, for Fun and Profit


