How Graph Databases Help Smart Homes Become Connected Homes

There is nearly limitless potential for smart home automation to alter the way that humans go about about their days. With innovations like smart kitchen appliances, custom weather forecasts and even personal robots, there is a plethora of devices that promise to help smart homes make our lives simpler.
In addition to making our lives easier, analyst firm McKinsey believes that IoT has the potential to create an economic impact of $200 billion to $350 billion annually in 2025. The firm predicts that IoT will have uses for everything from chore automation to personal banking. According to analysts, the average smart home may have anywhere from 50 to 100+ connected ‘things’ via wireless sensors, like appliances and lighting.
Furthermore,according to Zion Marketing Research, the smart home market is being driven by awareness amongst consumers about energy consumption, the growing aging population, rising disposable income in developing countries and government initiatives amongst others.
However, consistently delivering truly smart environments outside of some isolated examples is still a ways off. A smart home is far more than a home that turns the heating on before you return from work. At its most basic, a smart home has sensor-enabled ‘things’ as part of the larger Internet of Things (IoT), along with a way of using the data generated by the sensors.
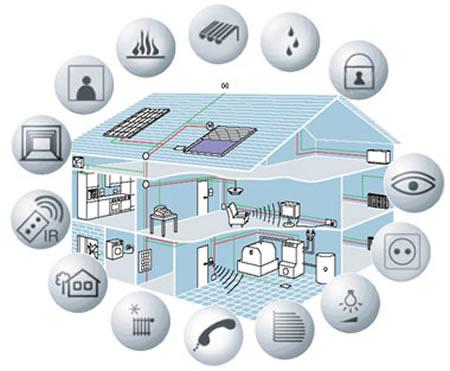
A smart home is fundamentally an IoT infrastructure, as it uses different parts of the house to communicate to a central control system using different varieties of sensors and devices. Things like smart meters and cameras are connected via a network. Using the IoT data that the sensors generated is where the real brainpower begins.
To make your home smart, devices and sensors need to be able to interact seamlessly. The level of how smart your home is depends on the level of data integration. This infrastructure connects many different devices that need to be able to connect the dots between the data being shared. When a new device or sensor comes online, it needs to automatically find out exactly what it needs to listen to or where to share data. Intelligent learning systems that can predict preferences by using pattern matching of data is the pinnacle of integration. This allows you to get your coffee the way you like it every single time, or keep your shower at your preferred temperature.
When looking at smart homes on a metropolitan scale, the main challenge is how to manage the complexity and enormity of these connections. Handling these enormous quantities of data is a massive task alongside the complexities of connecting often diverse devices. To provide a solution we have to look back to the network, where ‘things’ talk to one another so they can interoperate both locally and globally via robust and secure connections.
Simple sets of smart home data could be compiled on a relational database, but they are far from ideal as they represent data as tables, not networks. Queries put a huge burden on a data structure that has not been created for mapping connections. This is the reason why graph databases have become the answer to charting complex home networks.
For example, Nordic and Baltic telecommunications leader Telia Company recently announced it is using graph platform to power its smart homes initiative.
Telia has developed Telia Zone, a digital ecosystem and platform for broadband connections, which is already used by 1.2 million Swedish homes. Graph-powered smart home management is a key feature of the service, which provides the foundation to integrate different ‘things’, while also providing a consistent user-centric interface.
Telia Zone provides the infrastructure for Telia partners to develop innovative services. Telia Zone and APIs are also open to developers. Without any extra installation, Telia customers get access to these services, such as home security, entertainment and more. A favorite example they cite is compiling a dinner party playlist by recognizing the spotify preferences of the phones connected to the home network.
Telia Zone utilizes graph technology as a key part of its backend management. The majority of APIs required are formed on relationships between different types of events or different types of data. Graph databases have been spotlighted as the best way to connect these data nodes. This is because they provide a highly flexible and agile framework for storing, managing and querying highly connected data.
Telia Company does not know exactly which APIs will go on into development, but graph has the power to create connections and form new APIs out of any that may be coveted. Telia Company is also looking to explore the use of AI and machine learning in the future and believes that graph is the best route to handling these new technologies.
The total volume of the amount of data coming down the pipe is massive – Cisco estimates the amount of big data could hit 600 ZB by 2020. To put that into perspective, it is thirty nine times higher than projected data center traffic. A chunk of this data will be accumulated from smart homes.
The great thing about graph databases is that data can grow organically, quickly and easily connect with a growing list of ‘things’. It therefore makes perfect sense to consider graph technology for the complex data and many connections that the smart home needs to track to operate efficiently.

About the author: Emil Eifrem is CEO of Neo4j (formerly Neo Technology) and co-founder of the Neo4j project. Before founding Neo, he was the CTO of Windh AB, where he headed the development of highly complex information architecture for enterprise content management systems. Committed to sustainable open source, he guides Neo along a balanced path between free availability and commercial reliability. Emil is a frequent conference speaker and author on NoSQL databases. His twitter handle is @emileifrem.
Related Items:


