How the Lack of Good Data Is Hampering the COVID-19 Response

via Shutterstock
We don’t have perfect data on COVID-19. That much is painfully obvious. But is the data we have good enough to make sound decisions? That’s the question that many people are asking as political leaders consider lifting social-distancing restrictions and resuming public life following the unprecedented coronavirus lockdown.
Ideals of data quality and data transparency are taking on greater importance as political leaders around the world espouse the importance of taking a data-driven approach to reopening their countries. Basing the lifting of restrictions on unequivocal science, as opposed to gut instinct, will give us the best odds of avoiding a nasty viral rebound, they say.
Unfortunately, the data that our leaders are relying upon isn’t in great shape, according to data experts who talked to Datanami. While different categories of data are better or worse, there are real concerns about the quality and availability of data underlying some of the most important metrics that are being used to gauge our progress in fighting the novel coronavirus.
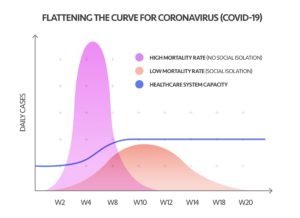
Take the daily COVID-19 new case count and hospitalizations, for example. These metrics are at the heart of the public call to “flatten the curve” and avoid overwhelming hospitals with a surge of sick people, a certain percentage of whom will need intensive care unit (ICU) beds and ventilators, both of which are in short supply. But the data collection mechanisms underlying these metrics are not as reliable as one would hope.
Instead of a national health surveillance system that we can rely on to give us good data, we have a patchwork of voluntary data gathering processes in place at area hospitals. Not all hospitals report the data, and the data is not consistent from hospital to hospital.
That leads to less confidence in the national “heads and beds” numbers, as well as the models that flow from those figures, according to Tina Foster, vice president of advisory and analytics visualization service at Change Healthcare, which develops analytics software used by healthcare providers.
“There are hospitals at this point that are reporting that bed data voluntarily,” Foster says. “It’s still a very manual process. So that creates a challenge in getting the high confidence in that current ‘heads and beds’ data.”
In particular, Foster says the lack of confidence in “the denominator,” or the fraction of people who have been exposed to the novel coronavirus and thus is used to compute COVID-19’s mortality rate, further confounds data-driven decision-making.
“What we’re discovering is that much of the data and the models are flawed simply because we don’t have that national surveillance to really get accurate information on who has the disease, who’s asymptomatic, and looking at the denominator, which really drives the confidence of the models,” Foster told Datanami recently.
The COVID-19 data was such a mess that the folks at Talend took it upon themselves to create their own repository of high-quality coronavirus data, de-duplicated and standardized to make it easier to crunch using column-oriented analytical databases. They have even taken the data engineering effort to load it into AWS Redshift, although users can use the data warehouse of their own choosing.
“I think we’re learning lots of lessons in terms of preparedness,” says Fraser Marlow, who works with Talend’s Stitch team. “Had we had a massive plan from the get-go, we could have a much better job worldwide at tracking this pandemic.”
Being data-driven sounds good in theory, but it’s notoriously difficult to pull off in practice. Enterprises of all sizes struggle to effectively wrangle their data, prepare it for analysis, and then use the resulting analysis to make forecasts that improve their businesses. It would be truly remarkable if disparate public health organizations around the world were able to dial in their data strategies in a short period of time and execute a flawless data-driven performance to fight COVID-19. Sadly (but unsurprisingly), that didn’t happen.

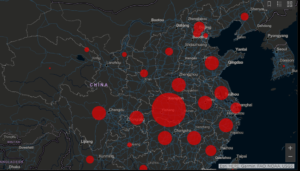
Johns Hopkins University is tracking novel coronavirus cases here.
“I think it’s very easy to be smart after the fact,” Marlow says. “But this is also the kind of after-the-fact thinking that we see by organizations. You think ‘Well, surely you’ll be able to map all this data out nice and clean on a piece of paper.’ But especially now, in the midst of the COVID-19 crises, people are reacting rather than planning. So at this point, it’s a scramble.”
AtScale has also taken it upon itself to use its distributed OLAP query engine in the fight against COVID-19. The company is partnering with cloud data warehouse vendor Snowflake to enable organizations to crunch epidemiological data about COVID-19.
The offering, made in conjunction with Boston Children’s Hospital, will help “fill a fundamental gap in access to trusted data,” according to AtScale CEO Chris Lynch.
“In recent weeks, I’ve had many conversations on the multitude of new challenges confronting our society today. One recurring theme I heard was the lack of access and want for trusted, up-to-date COVID-19 data,” Lynch said in a press release last week. “Given AtScale’s unique position to help make sense of information in real-time, our team jumped into action to provide users with the tools needed to drill into data and better understand the impact of the COVID-19 virus.”
One of the most important figures informing COVID-19 strategies is the number of people who have been infected. A number of snafus slowed the manufacture of COVID-19 test kits in the United States, which has hurt the ability of public health officials to develop a data-driven plan to attacking its spread.
But lately, it appears that the number of people who have been exposed to the novel coronavirus and didn’t have any symptoms is possibly much greater than public health officials have been assuming. The results of two antibody tests conducted by universities in California recently indicate that 28 to 85 times more people have been exposed to COVID-19 than have been detected using the PCR method.
With that denominator in place, the death rate from COVID-19 pencils out to be 0.12% to 0.20%, which is much less lethal than the 2.5% to 3% mortality figure that public health officials have been working with. The lethality rate of seasonal influenza is about 0.10%.
When there are errors in raw data, they can magnify themselves when they’re used as the basis for models, says Matt Holzapfel, a solutions lead at Tamr, which develops data quality software used by corporations.
“In any forecasting models, a small error in the data become a massive error the farther out you get, and so right now, I feel confident in our ability to maybe model out a couple of weeks,” Holzapfel told Datanami in mid-April. “But any clams based on what the world is going to look like in six months or even three months–I think is very difficult to make a quantitative assessment on any of that.”
It would be easier to make a qualitative forecast, Holzapfel says, but the data isn’t strong enough to be able to put out a numerical forecast with any degree of confidence. “It sounds good to have that absolutely number, what things are going to look like,” he says. “But the data inputs aren’t strong enough and I don’t think we can build a good enough model because we don’t have enough data around it in order to do that.”
Better data and better tools is needed across the board, says Informatica’s chief federal strategist Mike Anderson.
“The global novel coronavirus pandemic has made it abundantly clear that many organizations – including government agencies – have not invested enough in their data and technology strategies,” Anderson tells Datanami via email. “Our healthcare providers, researchers, governments and business leaders need high-quality, real-time data in order to make informed decisions around policy, potential treatments, public health guidance, and employee safety.”
The decision to re-open the economy requires strong data quality and integrity, Anderson says.
“Without consistent data standards, there’s potential for double-counting or mis-counting patients who come in contact with multiple healthcare practitioners,” he says. “Maybe they report their symptoms initially in a telemedicine appointment, and then eventually visit a hospital where the case is duplicated. With testing scarce, epidemiologists are looking at hospitalizations as an indicator of how the coronavirus is spreading, but varying demographics across regions make it difficult to extrapolate a hospitalization rate or total case count that could inform critical next steps, such as when and how businesses reopen or where the next hotspot that needs life-saving supplies may be located.”
Glen Rabie, the CEO of BI software provider Yellowfin, has strong feelings about how public officials have used data during the COVID-19 response.
“What I’m grossly disappointed of, by all governments, ours included and anywhere else, is the ability to simplify and to provide the community with an understanding of what’s going on between the levers they’re pulling and the reason they’re pulling those levers,” Rabie says. “We’re all living at home and wondering what’s going on. There’s this complete feeling of lack of control.”
In his view, government officials in multiple countries have not adequately taken into account the consequences of the lockdown in their analysis. “When you take a step back and look at the totality of health outcomes globally,” he says, “if you align that with poverty and suicide rates and family violence, if you had all those metrics in one page, you might have different policy decision.”
Related Items:
New COVID-19 Model Shows Peak Scenarios for Your State
Localized Models Give Hospitals Flexibility in COVID-19 Response
Coming to Grips with COVID-19’s Data Quality Challenges


