Grafana Labs Announces General Availability of Grafana 7.0

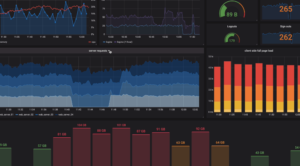
A sample of a Grafana dashboard. Image courtesy of Grafana Labs.
Grafana Labs, which heads up the open-source Grafana and Loki projects, has announced the general availability of the 7.0 release of its Grafana analytics tool. The new release touts a series of improvements, including new plugins, libraries, transformations, and more.
Grafana, first released in 2014, is a multi-platform analytics tool that offers visualization, alerts, and insights. Its customizable dashboards can connect to dozens of data sources. The company says that Grafana now has over half a million active installations comprising millions of dashboards.
In the new release, which Grafana Labs says involved nearly 18,000 commits from 362 contributors around the world, there are four key areas of enhancements:
- Data unification and connection improvements, including new plugins resulting from partnerships with Google, Microsoft, Amazon; new component libraries, tools, and data structures; and a rebuilt common and unified data and plugin framework based on Apache Arrow.
- Data processing and transformation improvements, including a shared set of common data operations; new transformations that allow renaming, summarizing, combining, and more across different panels, among other functionality; and a new data inspection feature.
- Faster data visualization, enabled by a new request tracing viewer; a range of automatic rendering options; and new panel options and a new editing experience.
- New enterprise features including Okta and SAML team syncs; searching and dashboard reporting for usage trends; and the ability to identify concurrent dashboard users for collaboration.
“I can’t wait to get this in the hands of our users,” said Torkel Ödegaard, creator of Grafana and co-founder and CGO of Grafana Labs. “This is truly a major release for us — not just a .0 or laundry list of features, but a fundamental, system-wide advancement. With this release, users are going to experience an increase in speed to visualization, along with a host of capabilities that will give them one place, at the user level to perform simple and complex functions and transformations on their data. […] Grafana is becoming an ideal tool to speed and ease essential data transformations and reduce the need to perform disjointed transformations through a variety of query languages outside the dashboard.”
This announcement comes on the heels of Grafana Labs’ 1.0 release of Cortex (a Prometheus-capable monitoring system) just over a month ago, as well as its 1.0 release of Loki (a multi-tenant log aggregation system) around six months ago. In October, Grafana Labs closed a Series A funding round with $24 million. At the time, Ödegaard said the funding would allow Grafana Labs to stay true to its roots while accelerating its investments in open-source and commercial products.
Related Items
Cortex, a Prometheus Spinoff, Boosts Data Monitoring
Speech Analytics Makes Unexpected Discovery


