AWS Launches Visual Data Prep Tool
AWS this week unveiled Glue DataBrew, a new visual data preparation tool for AWS Glue that’s designed to help users clean and normalize data without writing code.
Data preparation is the Achille’s Heel of advanced analytics and machine learning, as it regularly consumes upwards of 80% of data scientists and analysts’ time. However, without spending this time to clean, transform, and prepare data for analysis or for training machine learning models, the analysis or ML activity risks being flawed.
Many individuals and software vendors have attempted to reduce the time spent on data prep by automating the process. They have been met with mixed success, however, and ETL remains an entrenched part of the process.
Now AWS is throwing its hat into the ring with Glue DataBrew. In addition to providing a no-code visual environment, the offering brings more than 250 pre-built transformations to automate data preparation tasks. Instead of hand-coding transformations to handle challenges like anomalies in the data, standardizing data formats, or correcting invalid values, users can tap the pre-built functions in Glue DataBrew to do the work for them.
The offering works with any CSV, Parquet, JSON, or .XLSX data housed in S3, Redshift, and the Relational Database Service (RDS), or any other AWS data store that is accessible from a JDBC connector. Any data that’s indexed by the AWS Glue Data Catalog can also be brought into Glue DataBrew purview, AWS says.

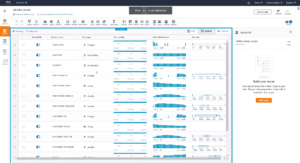
AWS Glue DataBrew provides a visual environment for cleaning, transforming, and preparing data for analysis and ML training
“Once your data is ready, you can immediately use it with AWS and third-party services to gain further insights, such as Amazon SageMaker for machine learning, Amazon Redshift and Amazon Athena for analytics, and Amazon QuickSight and Tableau for business intelligence,” writes AWS Chief Evangelist for EMEA Danilo Poccia in an AWS news blog post.
Users begin working with the offering by creating a project in the Glue DataBrew console, where they can visually explore one data set, or join multiple data sets together. The console provides pre-built histograms, box plots, and visualizations that give the user an idea of the values of the data. For an even richer view, users can run a job in the profile view, which generates more than 40 statistics about users’ data sets.
By selecting a column, the user can see an automatically generated recommendation for how to data quality. They can also select from the 250+ transformations built into the tool, which compose the individual steps that make up a recipe.
Users can save these recipes for later use, and also share them others, thereby providing a repeatable way to automate the transformation of data. These recipes can also be run against large data sets as batch jobs. Glue DataBrew also tracks the lineage of data as the projects, recipes, and jobs run over time, providing a way for users to work backwards and spot errors if they develop down the line.
“It’s never been easier to prepare you data for analytics, machine learning, or for BI,” Poccia says. “In this way, you can really focus on getting the right insights for your business instead of writing custom code that you then have to maintain and update.”
AWS Glue DataBrew is available today in US East (N. Virginia), US East (Ohio), US West (Oregon), Europe (Ireland), Europe (Frankfurt), Asia Pacific (Tokyo), and Asia Pacific (Sydney).
Related Items:
Data Prep Still Dominates Data Scientists’ Time, Survey Finds


