Mining Twitter Data for Disease Risk
Researchers from the University of California, Los Angeles (UCLA) and Virginia Tech are using real-time social media data to track the incidence of HIV and drug-related behaviors with the intention of guiding future prevention efforts.
As part of recent study published in the journal Preventive Medicine, the researchers collected a large number of tweets and created a map displaying the geographical location of the HIV-related tweets. They compared this data with mapping data from AIDSVu.org, an interactive online map that illustrates the distribution of HIV cases in the US. The results of the study showed a significant positive relationship between HIV-related tweets and HIV prevalence.
The vast amount of data available through today’s social networking channels opens up unprecedented opportunities to evaluate and detect sexual risk and drug use behaviors. Previous studies have shown that drug use is linked with a higher risk of sexual transmitted disease, including HIV. Now by monitoring geo-located tweets, mapping where those messages come from and linking them with data on the geographical distribution of a given disease, researchers can identify areas of concern and even potentially even prevent outbreaks.
“Ultimately, these methods suggest that we can use ‘big data’ from social media for remote monitoring and surveillance of HIV risk behaviors and potential outbreaks,” said lead author Sean Young, assistant professor of family medicine at the David Geffen School of Medicine at UCLA.
Young is also the founder and co-director of the Center for Digital Behavior at UCLA. Established this year, the multidisciplinary center provides a forum for academic researchers and private sector companies to jointly explore how social media and mobile technology can increase our understanding of human behavior.
 |
|
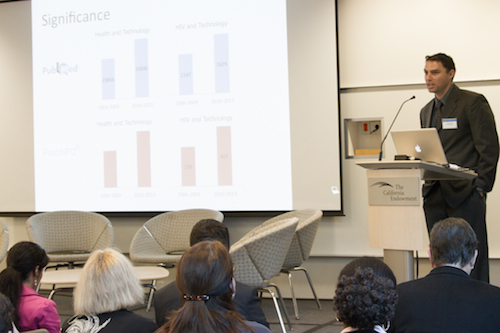
| Sean Young presenting at the CHIPTS conference | |
For the study, the research team collected more than 550 million tweets between May 26 and December 9, 2012. They created an algorithm to filter tweets based on whether they were suggestive of HIV-related risk behaviors, using key words and phrases, such as “sex” and “get high.” The algorithm captured more than 9,800 tweets, 8,538 of which were indicative of sexually risky behavior and 1,342 with references to stimulant drug use. The geolocated tweets were used to create a visual map, depicting the origin of these HIV-related tweets. When the tweet data was merged with the AIDSVu.org map data on national HIV cases, statistical modeling showed a significant positive relationship (p < .01) between HIV tweets and HIV prevalence.
Not surprisingly, the states with the highest number of tweets, both overall as well as HIV-related, were our nation’s most populous: California, Texas, New York and Florida. On a per capita basis, the largest number of tweets denoting HIV risk came from the District of Columbia, Delaware, Louisiana, and South Carolina. States with the highest per capita rate of general tweet activity were Utah, North Dakota, and Nevada.
The authors are confident in the feasibility of this method to study HIV-related outcomes. They note that the study’s main limitation was a lack of more recent HIV data; AIDSVu.org’s mapping data was last updated in 2009. For this approach to become a standard for detection and remote monitoring, the data will need to be frequently updated. Being able to compare tweets with disease outbreak in real-time would provide a very powerful public health tool.


